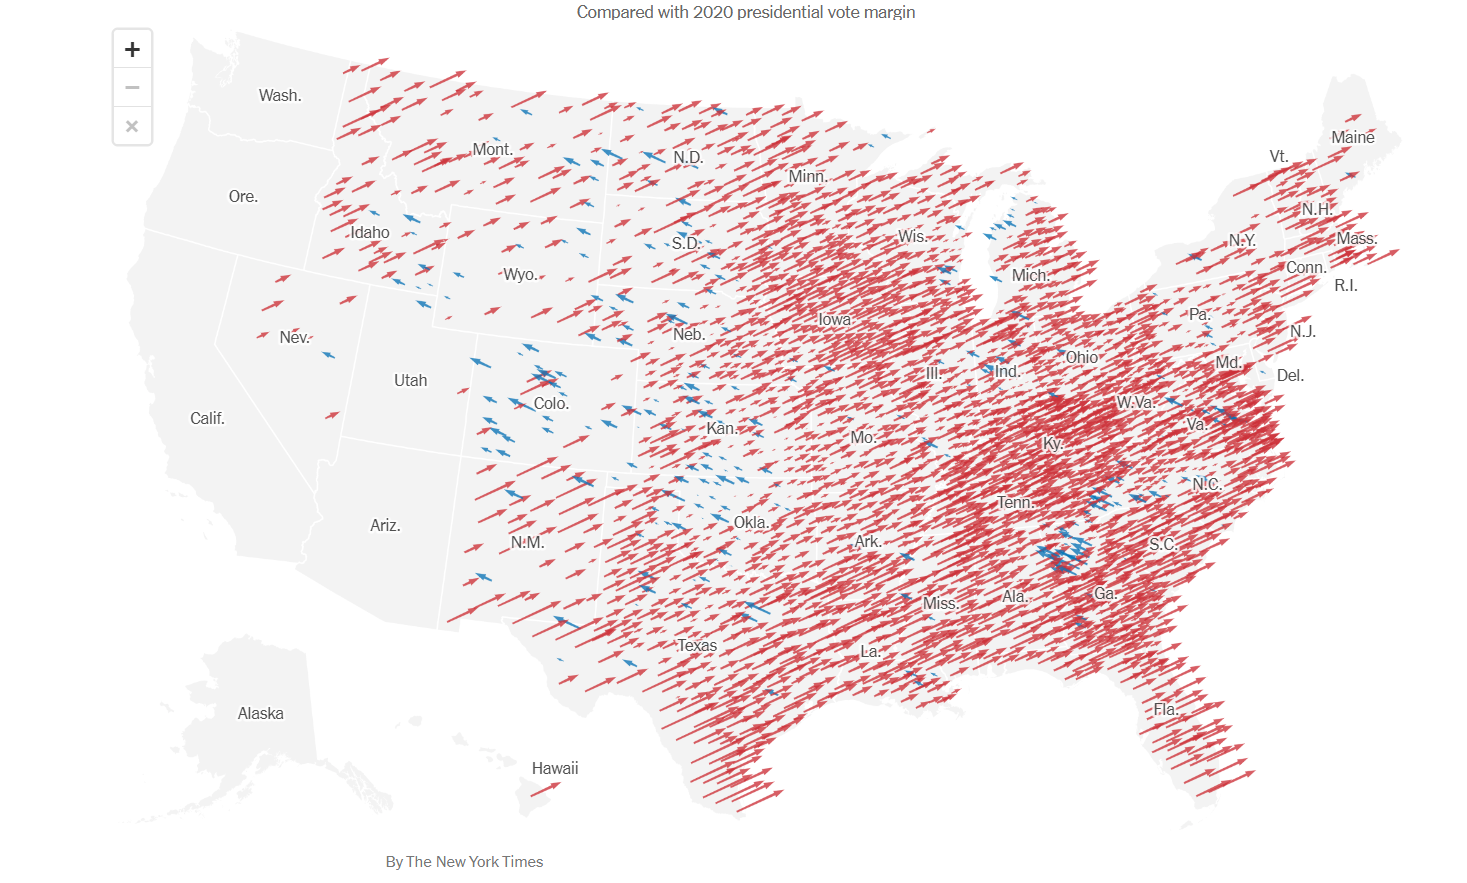
The 2024 elections have come and gone and it seems apparent that Republicans overperformed pretty much everywhere in the country, and Democrats underperformed nearly everywhere. The New York Times is referring to it as a “red shift.” We agree with this classification, as a “red wave” would have likely seen a much bigger victory for Donald Trump (R-FL) and Republican counterparts in the Senate and House. But the numbers that handed Trump that decisive win, as well as an astonishing four-point popular vote win, are indicative of a much larger, underlying shift within the American electorate.
Counties
The U.S. has 3,244 counties and county equivalents. Donald Trump improved on his 2020 margins in 2,367 of them, while his margins decreased in only 240. There are currently about 500 counties where such a trend cannot yet be observed until more votes are tabulated.
The map of the country is from The New York Times. It demonstrates just how much each county shifted and in which direction. The size of the arrow means a much bigger shift.
Right now, Vice President Kamala Harris’ (D-CA) largest shifts appear to be in the Atlanta metro area, with a 9.2% shift leftward for Henry County. Henry’s population is about 50% black, a demographic Trump significantly courted across the nation, but the suburban lean of Henry County, along with a much younger population overall in the Atlanta area, is likely why Harris is seeing her best improvements here.
Meanwhile, Trump actually improved his margins in the core Atlanta counties (Cobb, DeKalb, and Fulton). The Atlanta shifts appear to be her greatest yet.
Interestingly, she also outperformed Joe Biden’s (D-DE) numbers in several counties in western Oklahoma, western Kansas, and all across Colorado.
But Harris’ numbers pale in comparison to Trump’s. Notable jumps include a nineteen-point swing rightward in Miami-Dade County, Florida, a twenty-one point swing in Starr County, Texas – the county with the largest percentage of Hispanics in the country – and a fourteen-point swing rightward in Rockland County, New York.
In 2020, Trump won Suffolk County by just 0.03%. On Tuesday, Trump carried Suffolk 55%-45%, a ten-point shift to the right.
In 2020, Biden won Nassau by about ten points. It appears that Trump will win the county by about four points, indicating a fourteen-point swing to the right.
Demographics
The demographic shifts in this election are the main reason for the results we received. It’s been an assumption for decades that Democrats receive large proportions of the black, Hispanic, and Asian votes, as well as the young vote and some older voters as well. The coalition appears to have broken, at least somewhat, as Trump’s victory was substantiated by significant shifts in several key categories.
Among counties where Trump by more than twenty points four years ago, those counties shifted 2.8% to the right, while counties that Biden had won by an equal margin in 2020 shifted almost 4% to the right this year.
That’s a stark contrast from last year, when both of those categories shifted left. Of the eighty-five urban counties where results are in, Trump swung them to the right by 5.2%, after those same counties shifted left almost 3% in 2020.460 suburban counties have posted results and Trump swung them 4.3% right, almost mirroring Biden’s shift of the same group in 2020.
834 counties have a white population of more than 90%. Biden swung them very narrowly in 2020, but Trump pulled them 2.5% to the right this year.
Of perhaps a greater shock, 290 counties with a white population of less than 50%, Trump swung them seven points rightward.
347 counties of a black population of 25% or greater shifted right 4.1%, despite swinging left 2.5% last year. Meanwhile, and perhaps of greater shock, of 228 counties with a Hispanic population of at least 25%, Trump received his most dramatic swing yet: 9.5%. It was one of two demographics where Trump improved in 2020.
Of the 43 counties that are over 50% college-educated, Trump swung them 4% to the right, after they swung for Biden by 6% in 2020.
Trump continues with a 4.8% swing in 1,266 counties where less than 20% of the population is college-educated, the second and only other demographic where Trump improved the margins in 2020.
Of 302 counties with a large population of voters 65 and older, Trump swung them 4.9%, a significant development when Biden and Harris were, according to polls, courting this demographic rather well.
Finally, in ninety counties with a large young population – voters aged 18-34 – Trump swung those counties 5.6% right, after the same group shifted 4% in Biden’s direction last election.
What Does This All Mean?
We don’t expect our readers to know how each percentage corresponds to the sets of counties presented; it’s difficult even for us to parse through all the data. But what we can say from this information: these are monumental swings for a Republican president in the modern era. Should these swings become somewhat new floors for the GOP, then it would certainly complicate Democrats’ electoral prospects in multiple ways for the foreseeable future.
Moreover, while Trump was soundly defeated in 2020, he at least improved his 2016 standing in two categories, albeit narrowly. But Harris didn’t improve on any 2020 standings this election, and all were not razor-thin shifts in this era.
It remains to be seen just what kind of impact the 2024 results will have on American politics going forward, but most seem to agree that the Republican Party is redefined with a great coalition, while the Democratic Party might be in need of a similar restructuring.


